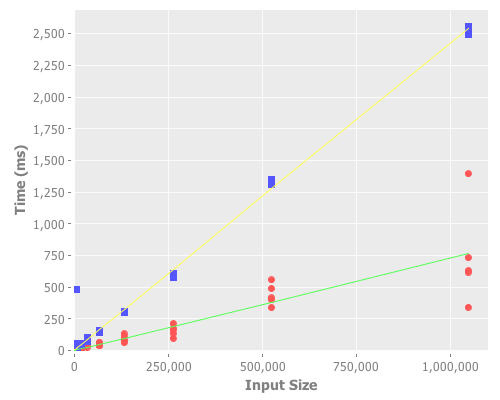
Updated: made a mistake in the random algorithm… left out the random part :) all fixed now and the chart has been updated
Last week we were going over some median finding algorithms in class. To be honest I had never thought of this problem before. In class (before the algorithms were revealed to us) I jumped to the naive approach of sorting the list then grabbing the middle. This is obviously going to have the complexity of sorting, with best case O(nlogn).
We were presented with two algorithms, one random (selection by partitioning) and the other deterministic (median of medians). Both end up averaging a complexity of n, but the random algorithm has a worst case of O(n2). The funny thing is that the random algorithm massively outperforms the deterministic version. This is always an iterating situation, when the theoretically better solution ends up performing (when implemented) far worse than the theoretically worse solution.
Lets see how much worse the deterministic algorithm performs. I created an implementation of both algorithms:
Conveniently both algorithms have the same core, and the only difference between them is how they determine their pivot value. As the name suggests in the random algorithm, the pivot is chosen at random. In the deterministic version, the pivot is chosen to be the median of medians. Finding the median of medians is interesting as the recursions are intertwined, the median finding algorithm is called by the median finding function.
There are also some laziness optimizations sneaking in here as well. In the core, only the “less than” partition is fully realized. The “greater than” partition is only calculated when required, which is only when the median exists within.
Alright, so now I got to take my first attempt at using Incanter, the R-type library for Clojure. Incanter was really easy to use and I found the documentation to be very verbose (in a good way) and well written.
This is the analysis code I whipped up:
Which I used to produce the following chart:

Due to some strange “features” in Incanter, you have to jump through some hoops to get the groups to label correctly, so I left the legend off the chart. The blue points are the deterministic algorithm’s results and the red points are the random algorithm’s results. As you can clearly see from the graph, the random algorithm outperformed the deterministic one by at least one metric bunch.
